UK Road Accident Dashboard Report
Introduction
This report presents the findings and insights derived from the Road Accident Dashboard created for the years 2021 and 2022. The dashboard aims to provide valuable insights to a diverse group of stakeholders, including the Ministry of Transport, Road Transport Department, Police Force, Emergency Service Department, Road Safety Corps, Transport Operators, Traffic Management Agencies, Public, and Media. The analysis conducted in the dashboard focuses on various aspects of road accidents, including casualties, accident severity, vehicle types, road types, road surfaces, and light conditions.
The dashboard was designed based on these Business Requirements:
- Clients want to create a Road Accident Dashboard for year 2021 and 2022 so they can have insight on the below requirements
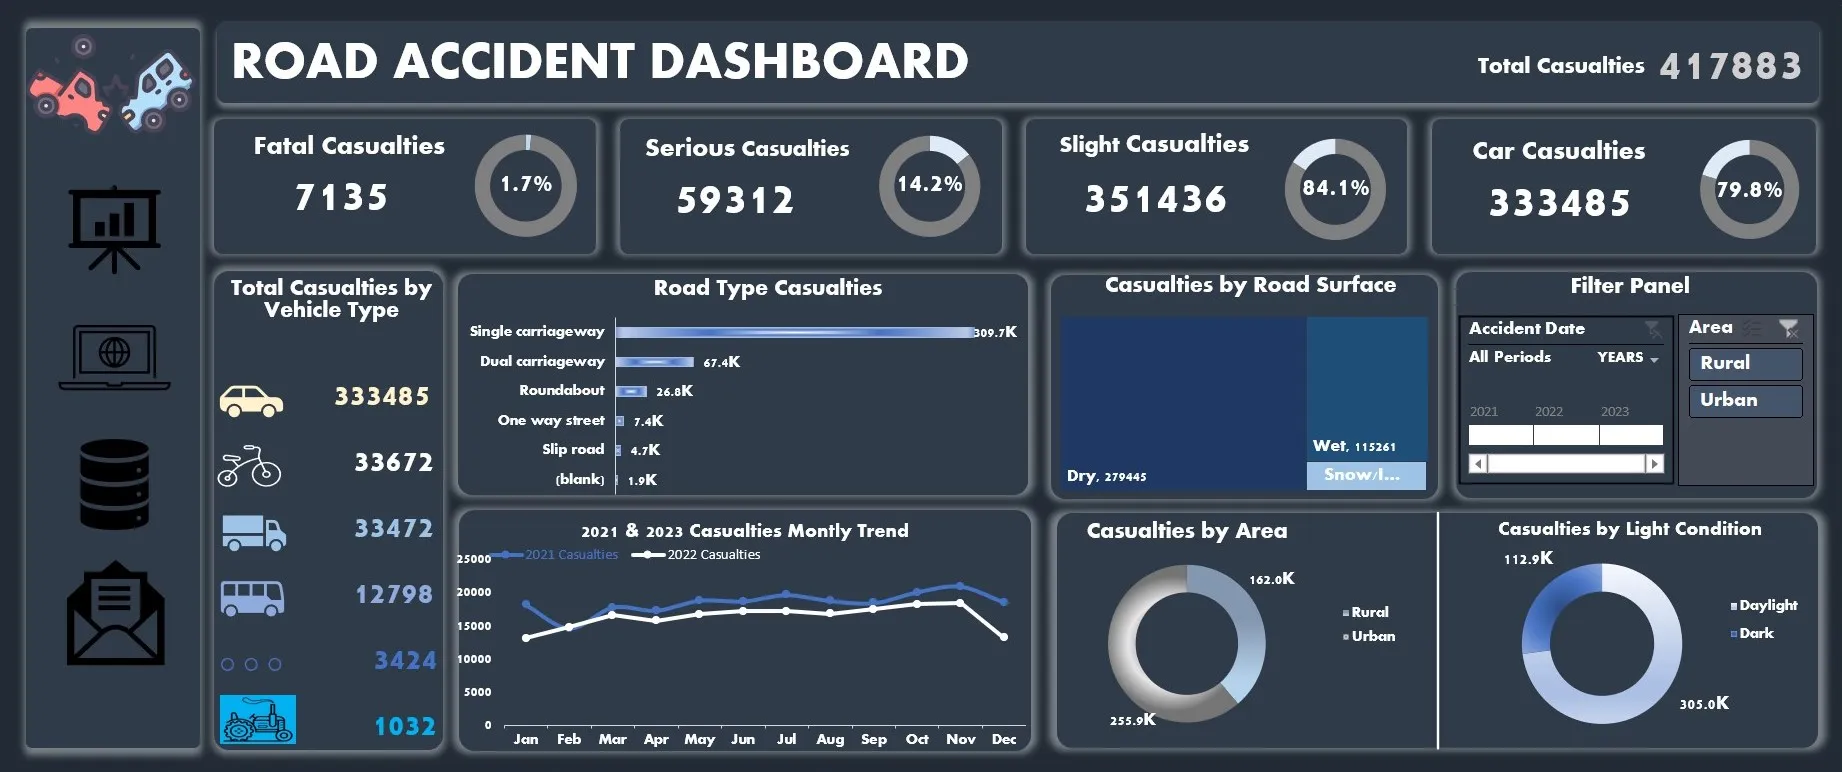
- Total Casualties taken place after the accidents. Pry KPI
- Total casualities & percentage of the total with respect to accident severity and max casualities by type of vehicle. Pry Kpi.
- Total casualties with respect to vehicle type. Sec KPI.
- Monthly trend showing comparision of casualities for current year and previous year
- Max casualties by road type
- Distribution of total casualties by road surface
- Relationship between casualties by area/location & day/night
Trends and Insights
Total Casualties:
The total casualties after road accidents show a decreasing trend from 2021 to 2022, indicating potential improvements in road safety measures. This reduction in casualties can be attributed to various factors, such as increased awareness, stricter regulations, and enhanced emergency response systems.
Casualties by Accident Severity and Vehicle Type:
Analyzing casualties by accident severity reveals that accidents involving Cars and motorcyclists have the highest number of casualties. This emphasizes the need for targeted safety measures for these vulnerable road users. Additionally, the dashboard highlights the proportion of casualties for each severity category, providing insights into the distribution of injuries and fatalities, this shows there are proportionof slight casualties over the years.
Casualties by Vehicle Type:
The distribution of casualties by vehicle type shows that cars and motorcycles have the highest number of casualties. This suggests the importance of promoting safe driving practices and raising awareness among drivers of these vehicle types. Moreover, understanding the specific characteristics and risks associated with each vehicle type can help inform road safety campaigns and interventions.
Monthly Casualty Comparison:
The monthly trend analysis allows for a comparison of casualties between the 2021 and 2022. This analysis reveals any seasonal patterns or significant changes in the number of casualties over time. Identifying these trends can help allocate resources effectively and implement targeted interventions during specific periods of the year when accidents are more prevalent.
Casualties by Road Type and Road Surface:
Analyzing casualties by road type helps identify areas with higher accident rates, allowing for targeted improvements in infrastructure and safety measures. Furthermore, examining casualties by road surface provides insights into the relationship between road conditions and accident severity. Single carriageway and dry surface road have the highest number of casualties. This information can guide maintenance efforts and prioritize areas in need of repairs or safety enhancements.
Relationship between Casualties and Light Conditions:
Studying the relationship between casualties and light conditions provides valuable insights into the impact of visibility on road safety.It shows that there were more recorded casualities in daylight and lesser in dark weather. The analysis highlights whether accidents are more likely to occur during daytime or nighttime, helping to identify areas that may require improved lighting or increased enforcement of traffic regulations during specific time periods.