SQL PROJECT (Hotel Revenue Data Analysis)
Goals:
- To develop a SQL database,
- To import tables into SQL database,
- To analyze and build a visual data story/dashboard using power BI to answer the following business questions and present it to the stakeholders;
- Is the hotel revenue growing by year?
- Should the holtels increase their parking lot size? They want to understand if there is a trend with guest with personal cars.
- what trends can we see in the data? focus on average daily rate and guests to explore seasonality
Data source: View here
Tools Used: SQL (Microsoft SQL Server Management Studio with Azure Data Studio), and Power BI (DAX, Power Query, and Power BI Service)
DATA ANALYSIS PROJECT PIPELINE
-
Build a Database
SQL Server was established using Microsoft SQL server 16, The project database was created under the localhost SQL server. Importation of the dataset into the database; the excel file was imported into the database. the file consists of five excel sheets, namely; 2018, 2019, 2020, market segment, and meal cost. -
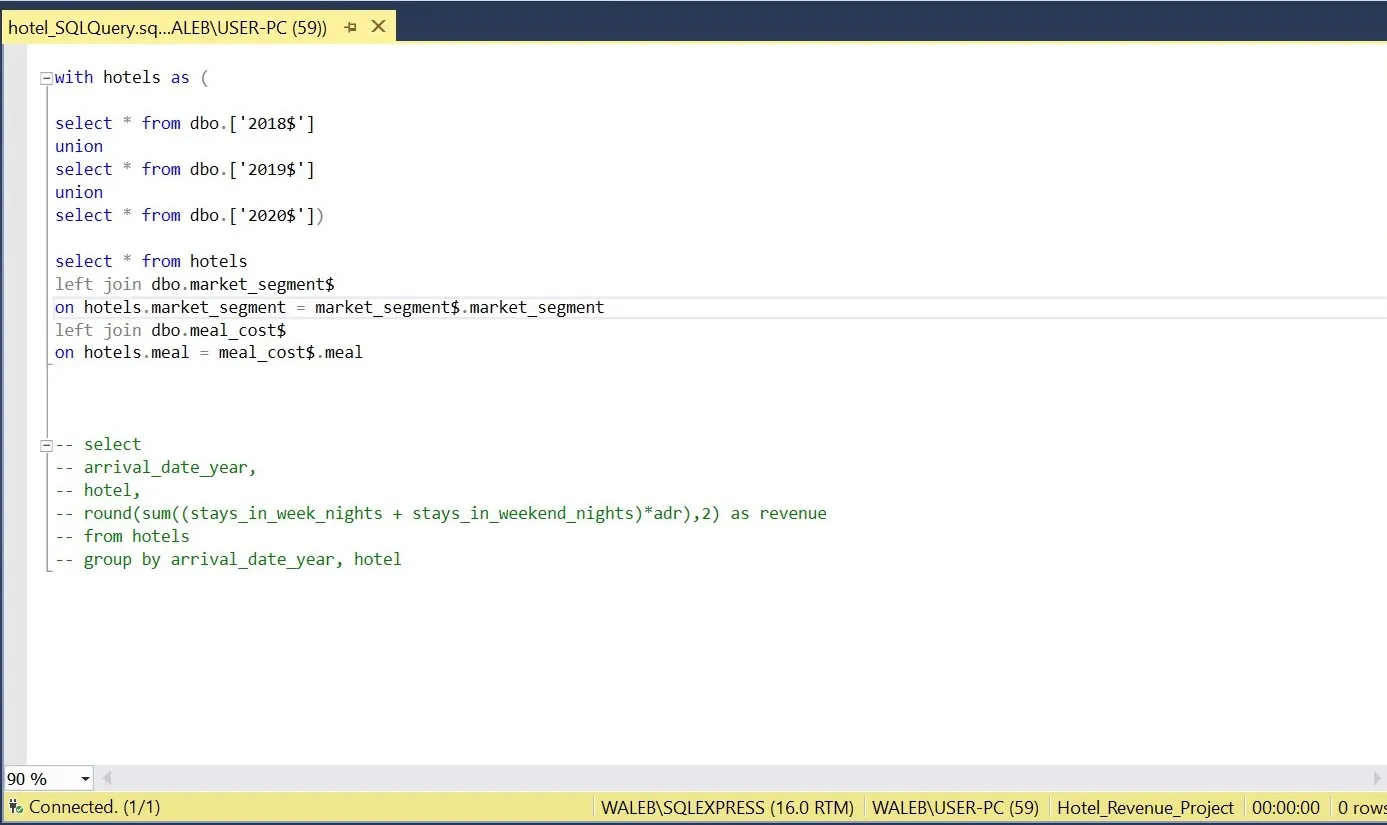
Develop SQL Query
Used Union SQL query to develop the data 2018, 2019, and 2020 into a unified single table. After the data merging, got a total of 100,756 rows with 32 columns. Used SQL Queries to answer this question; Is the hotel revenue growing? To answer the bsuiness question using SQL query, needed to create a revenue column. Created a new column for revenue; with the formular; (stays_in_weekend_nights + stays_in_week_nights) * adr (daily rate)
Selected revenue with hotels and grouped by the years.
From the result, There is a increase in revenue for each hotel by years.
Merged market segment table and meal cost table to the unified table. Left joined meal cost table and market segment to the unified table.
consolidated table
-
Extract data from SQL server into power BI
Added data via SQL server, copied the SQL queries used to join the sheets, and merged the tables. -
Data transformation and manipulation.
Did data cleaning and transformation in Power Query. By changing datatypes where necessary, and dropping of dulplicated columns. Also, added a custom column for the hotels revenue. Craeted measures for total nights, discount percentage.
Click to view the interactive dashboard
ANSWERS TO THE BUSINESS QUESTIONS;
-
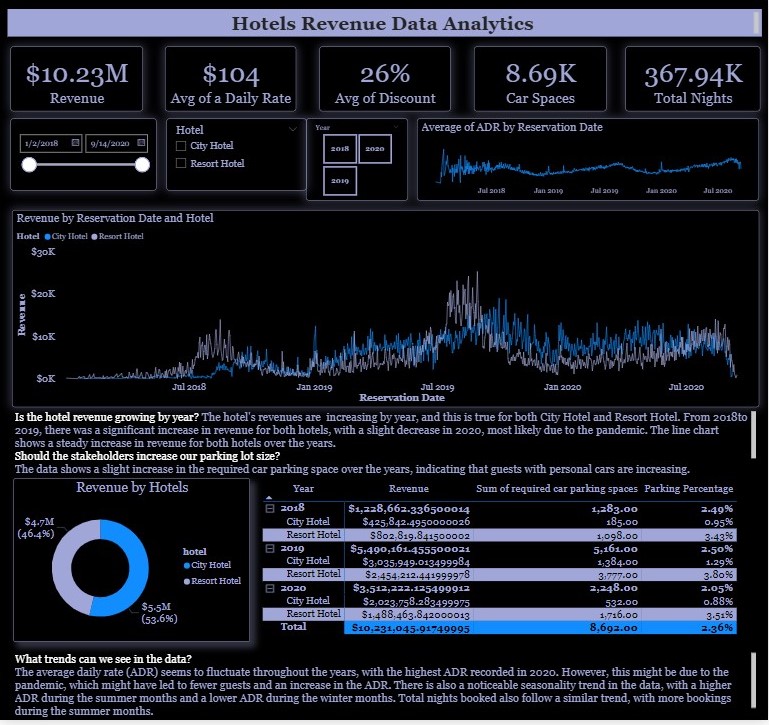
Is the hotel revenue growing by year?
The hotel's revenues are increasing by year, and this is true for both City Hotel and Resort Hotel. From 2018to 2019, there was a significant increase in revenue for both hotels, with a slight decrease in 2020, most likely due to the pandemic. The line chart shows a steady increase in revenue for both hotels over the years. -
Should the stakeholders increase the parking lot size?
The data shows a slight increase in the required car parking space over the years, indicating that guests with personal cars are increasing. However, it is important to note that there is no correlation between parking space and revenue. Therefore, increasing the parking lot size might not necessarily lead to an increase in revenue. It would be wise to conduct further analysis to determine the impact of increasing parking space on revenue. -
What trends can we see in the data?
The average daily rate (ADR) seems to fluctuate throughout the years, with the highest ADR recorded in 2020. However, this might be due to the pandemic, which might have led to fewer guests and an increase in the ADR. There is also a noticeable seasonality trend in the data, with a higher ADR during the summer months and a lower ADR during the winter months. Total nights booked also follow a similar trend, with more bookings during the summer months.
Based on the above analysis, it is recommended that the hotel management team take the following steps:
- Continue to focus on increasing revenue for both hotels by implementing targeted marketing campaigns and offering discounts during low season months.
- Conduct further analysis to determine the impact of increasing parking space on revenue.
- Consider adjusting pricing strategies during peak and off-peak seasons to optimize revenue and occupancy.
- Overall, with the growing trend in hotel revenue and the potential for increased revenue through targeted marketing campaigns and adjusting pricing strategies, the hotel management team should focus on these areas to drive future growth.