Overview
This dashboard provides a comprehensive view of Ethereum-USD (1st, march 2018 till present) based on a monthly timeframe and is designed to help crypto users to understand how ETHUSD has been performing for over 5 years and to have a forecast till August 2023. The data used in this dashboard is a live dataset scraped from Yahoo Finance. The information displayed in this dashboard is intended for informational purposes only and should not be used as the sole basis for making decisions. This dashboard includes interactive features that allow users to filter and manipulate the data to better suit their needs. The data and information presented in this dashboard are subject to change and I make no guarantee as to its accuracy.
I welcome feedback and suggestions on how to improve the dashboard. This dashboard is optimized for use on desktops and laptops and may not display properly on mobile devices.
Trends and Insights
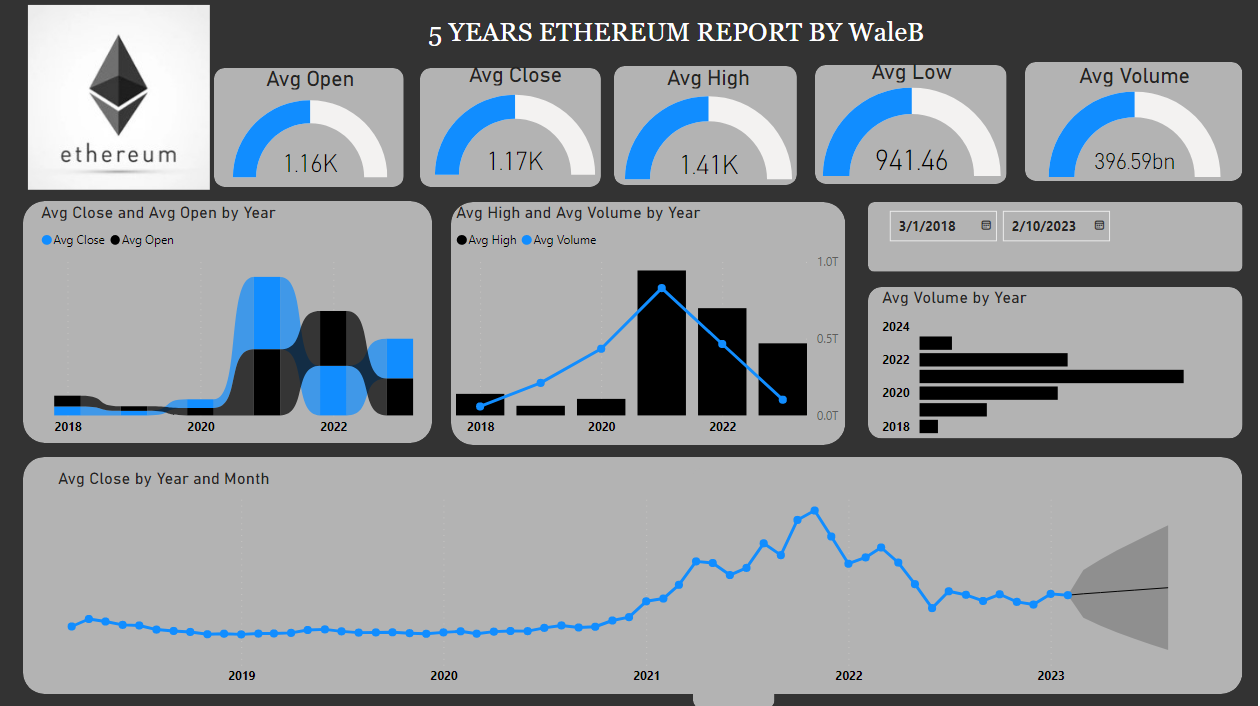
The Uninteractive Dashboard shows the performance of ETHUSD for 5 years with an average volume of 403.18 Billion,
Average Open Price of $1,160, Average Close Price of $1,170, Average high price of $1,410, Average low price of $931.3.