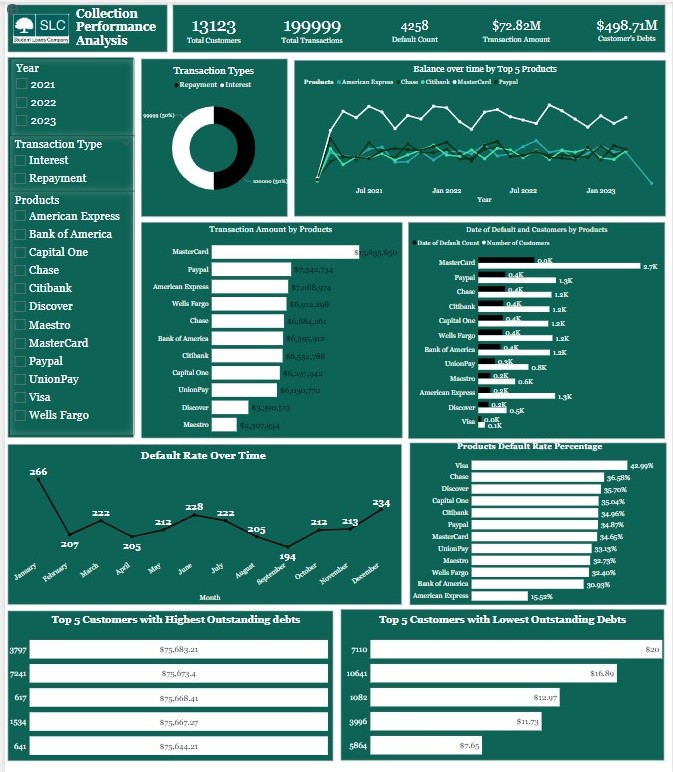
A collection performance analysis aims to assess the effectiveness of the company's collection strategies and processes.
Specifically, the analysis aims to identify areas where the company can improve its collections processes, reduce its default rates, and increase its recovery of outstanding debts. By analyzing key metrics such as the total number of customers, total transactions, total balance, and total amount.
Analysis Pipeline
- Data Cleaning:
Used Excel and R for data cleaning. In the transaction Table, all Transaction dates for interest payments were recorded as text/characters. Importing such data to Power BI would show an error. Decided to use R with the use of the Lubridate library to convert the column to a datatype that will allow any date functions to be carried out. - Data Joining:
Then joined the transaction table in Excel, - Data Presentation:
Changed columns to appropriate data types that fit the aim of the analysis and performed neccessary manipulation.Carried out data visualization using Power BI to create a Collection Performance Dashboard.

Trends and Insights
- The line chart showing the balance over time indicates that there is an up-and-down trend in the balance for the top 5 product types. The fluctuating trend in the balance for the top 5 product types indicates that the collection strategy is average.
- The line chart showing the balance over time indicates that there is an up-and-down trend in the balance for the top 5 product types. The fluctuating trend in the balance for the top 5 product types indicates that the collection strategy is average.
- The Bar chart shows that the most used product is the Master card with 20% of overall customers, and it has transacted the most.
- The doughnut chart shows the total number of Repayment and Interest transactions done, which are 37752 and 37870, respectively.
- The product type with the highest number of defaults also has the highest number of customers.
- But the right chart shows that the product type with the highest number of defaults and customers differs from the product with the highest default rate.
- Visa product has the highest default rate percentage compared to the master card with a higher number of customers and default count
- Most customers enter arrears after missing a repayment on their debt within the years. There has been an increase in the trend of debt counts over the years.
- The left chart shows the top 5 customer IDs with the highest outstanding debts in 2021.
- While the right chart shows the customer IDs with the lowest outstanding debts