Cryptocurrency Data Analysis
BTCUSD Performance Dashboad and Forecast Report
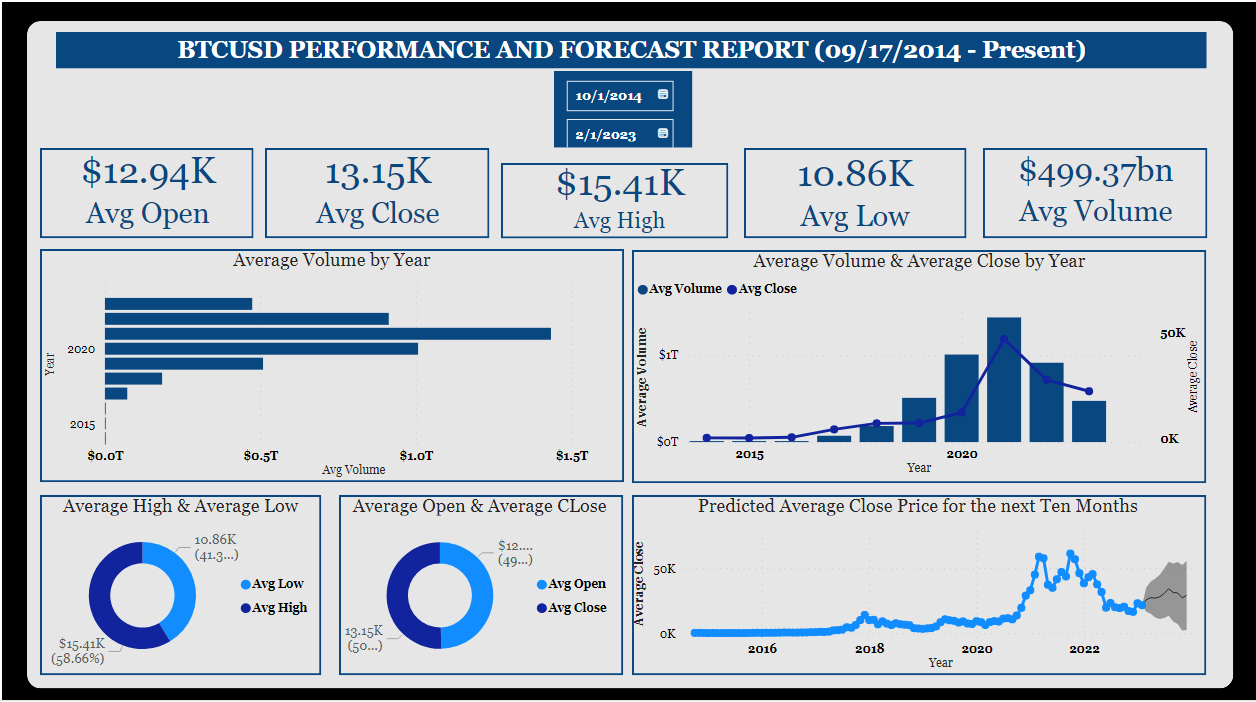
I created a #PowerBI dashboard for #cryptocurrency Users that wanted to #analyze #btcusd performance since September 2014 till date. The dashboard had several visuals that highlighted average prices and trends. First, created a Date Slicer, This allowed users to select date range to see #BTCUSD average prices, pattern, trends, and performances for the selected date range. I created #metrics and visuals that showed the performance of #BTCUSD over 10 years. This allowed #BTCUSD users to identify the days, months, and years BTCUSD pumped most and compare the performance of other months and years.
I added Cards that displayed the Average Open, Average Close, Average High, Average Low, and Average Volume of BTCUSD over the specific months and years. This allowed the users to identify the performances of BTC by each price categories for the timeframe. Included a clustered bar chat that showed the BTCUSD trends over time. This allowed the users to see how the pair volume has been increasing, decreasing, or remaining steady.