Power BI
The purpose of the dashboard is to provide the company with an easy-to-use tool to analyze their sales data and gain insights into trends and patterns that can help them make better business decisions.
The dashboard is designed to be interactive, allowing users to filter the data by various dimensions such as date, product category, salesperson, and payment type. The dashboard also includes visualizations such as bar charts, line graphs, and pie charts to help users quickly understand the data.
Trends and Insights:
Upon analyzing the sales data, several trends and insights emerged:
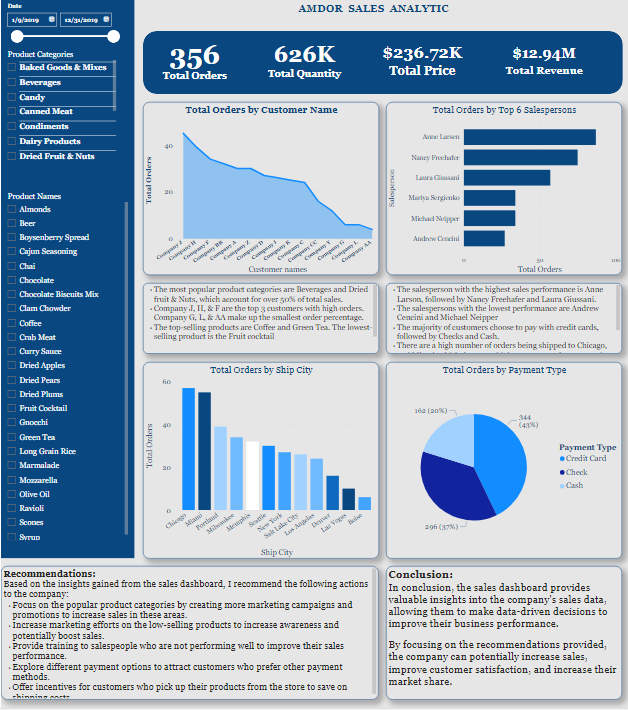
- The most popular product categories are Beverages and Dried fruit & Nuts, which account for over 50% of total sales.
- Company J, H, & F are the top 3 customers with high orders. Company G, L, & AA make up the smallest order percentage.
- The top-selling products are Coffee and Green Tea. The lowest-selling product is the Fruit cocktail
- The salesperson with the highest sales performance is Anne Larson, followed by Nancy Freehafer and Laura Giussani.