Covid_19 Exploratory Data Analysis Using SQL
The Covid-19 pandemic has had a significant impact on the global economy. The pandemic, which began in early 2020, has caused widespread disruption to businesses, supply chains, and financial markets.Some of the impact on Global Economy include; Economic Recession, Unemployment, Supply Chain Disruptions, Fiscal Stimulus, Shift to Digital.
In this project, I analyzed and explored covid data Starting from 8th January, 2020 to 19th April, 2023. with Tableau, SQL using Micrsoft SQL Server Management Studio.
Data source: Our World in Data
I will advise to download the latest dataset from the site.
I employed Tableau for data visualization (dashboard).

Trends and Insights:
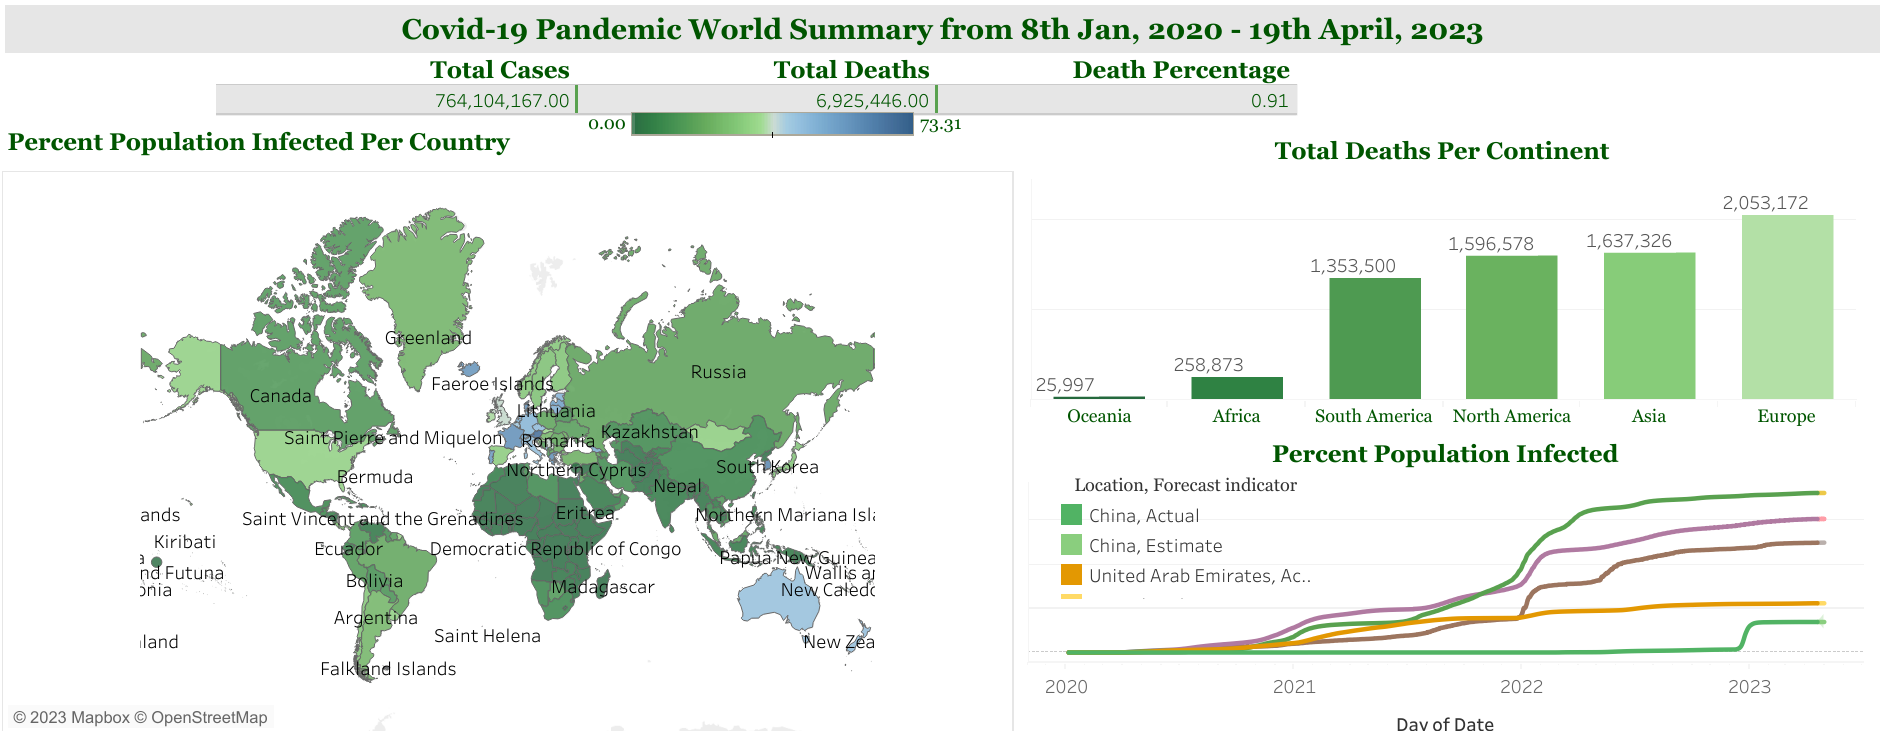
- Total Deaths per Continent: The bar chart on the dashboard shows that the highest number of deaths due to Covid 19 has occurred in Europe, followed by Asia, North America, South America, Africa, and Oceania. This trend shows that Europe and Asia were hit the hardest by the pandemic, while Oceania was the least affected continent.
- Percent of Population Affected per Country: The line chart of the population affected per country shows the trend of how many countries experienced a surge in Covid 19 cases in 2020, but the numbers gradually decreased in 2022. However, there was a slight increase in cases in early 2023. This trend indicates that many countries were able to effectively control the spread of the virus, but there is still a need for continued vigilance and precautionary measures.
- Percentage of Population Infected by Country: The map showing the percentage of the population affected by location (country) indicates that many countries have been severely impacted by the pandemic. The highest percentage of population affected was in Cyprus, followed by San Marino, Austria, and Faeroe Islands. This trend highlights the fact that some countries have been hit harder than others and that there is a need for global cooperation in managing the pandemic.